![]()
| Postprocessing of Continuum Analysis > Visualization of Seepage Analysis Data > Visualization of scalar and vector data |
|
|
|
|
||
Visualization of scalar and vector data
Contouring and vector re p resentation are the most generalized method of visualizing finite element analysis results, and are appropriate for visualizing the scalar or vector data directly obtained from a seepage analysis.
> Contouring of scalar data
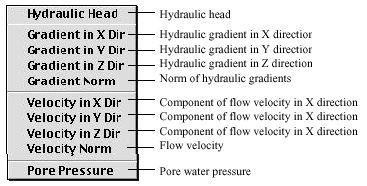
There are a number of data items obtained from seepage analysis, which appear in the popup menu(Windows: dropdown list) of "Contour Display" dialog as shown below The popup menu items are arranged in the same order as the data items are saved in the file. The scalar data from seepage analysis consist largely of hydraulic head, hydraulic gradient, flow velocity and pore pressure.

Various methods of applying contouring (for example, displaying contours on cut plane, parallel plane, etc.) are also valid for seepage analysis data. Refer to "Visualizing Scalar Data by Contours" section of this chapter. Other variant methods of displaying scalar data such as iso-surface representation and curve plotting can also be used in visualizing seepage analysis data. Refer to "Visualizing Scalar Data by Iso-surface and Others" section of this chapter.

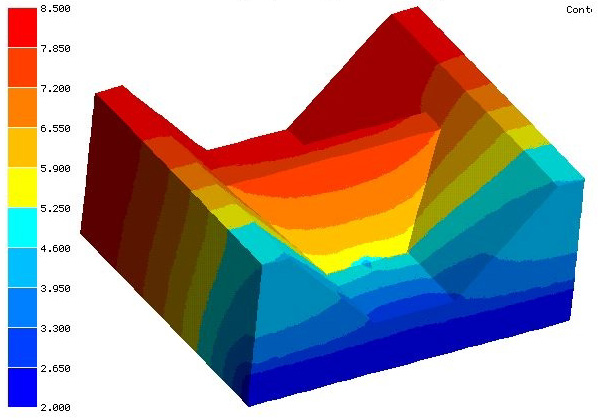
<Contour image of hydraulic head>
> Representing vector data
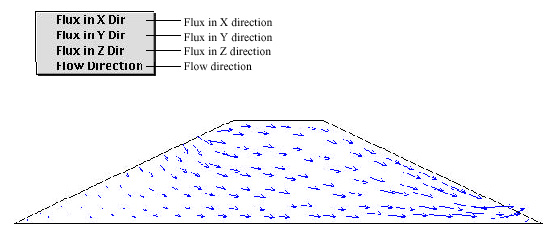
Flow velocities and its directions computed from seepage analysis can be visualized by vector representation. The X, Y and Z components of seepage flux can also be displayed by vector representation. Refer to"Visualizing Vector Data" section of this chapter for more detailed explanation on vector rendering.

<Vector representation of flow velocity and directions>
|
|
|
|