
|
Visualizing Scalar Data by Contours
|
|||
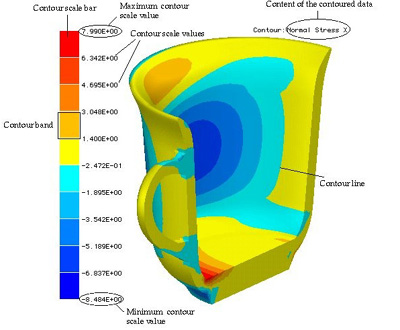 |
|||
|
Contour image
|
|||
|
Setting contouring options
|
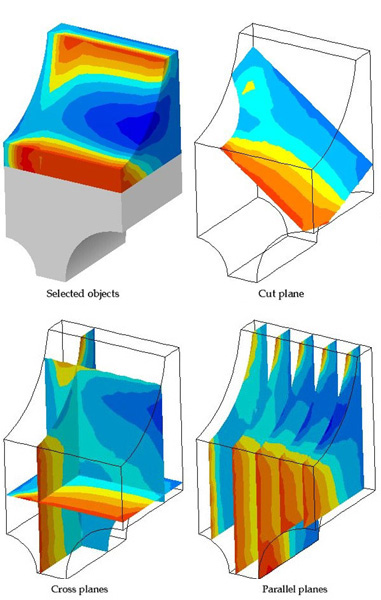
Designating the contouring object
|
||
 |
|||
|
Various
contouring objects
|
|||
|
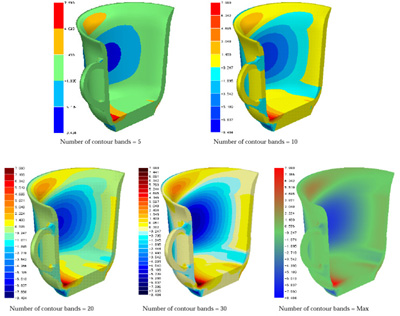
Setting the number of contour bands
|
|||
 |
|||
|
Comparison
of number of contour bands
|
|||
|
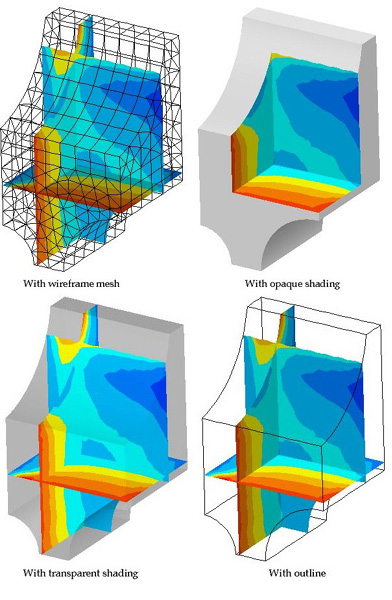
Selecting the contouring method
|
|||
 |
|||
|
Styles of
boundary surface rendering
|
|||
|
Turning the shading effect on or off
|
|||
 |
|||
|
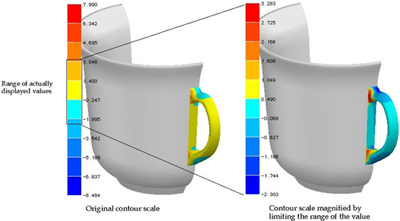
Limiting
the range of the contour scale
|
|||
|
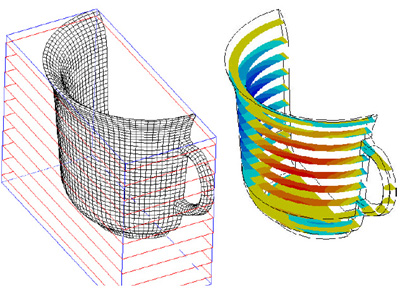
Setting parallel planes for
contouring
|
|||
 |
|||
|
Setting the
parallel plane and contouring on the plane
|
|||
|
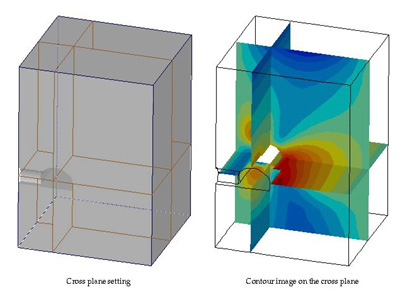
Contouring on cross planes
|
|||
 |
|||
|
Visualizing scalar data using
iso-surfaces
|
|||
 |
|||
|
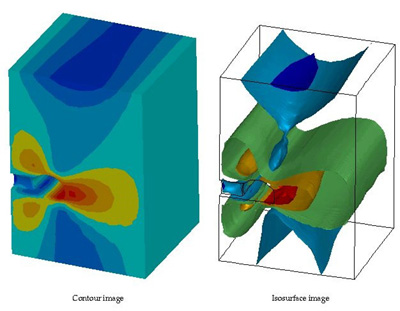
Comparison
of contour and iso-surface images
|
|||
|
Selecting the data item to be represented
by iso-surfaces
|
|||
 |
|||
|
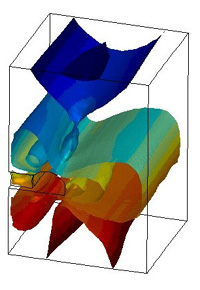
Iso-surface
image with contour
|
|||
|
Setting the number of iso-surfaces
|
|||
  |
|||
|
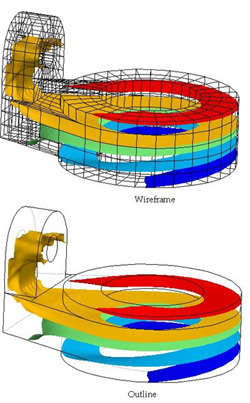
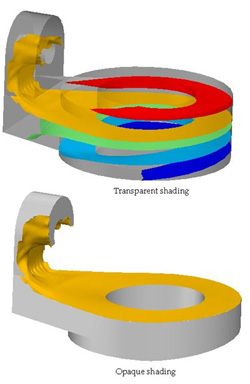
Boundary
surface rendering with iso-surfaces
|
|||
|
Designating the iso-surfaces as the boundary
of a truncated model
|
|||
 |
|||
|
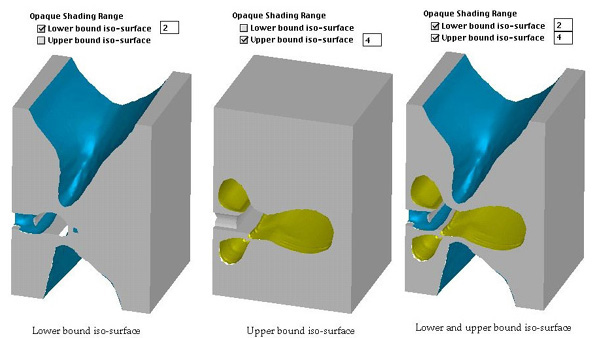
Model truncated
by iso-surfaces
|
|||
|
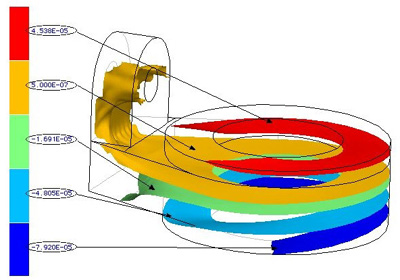
Limiting the range of iso-surface scale by actually
displayed values
|
|||
 |
|||
|
Scale bar
for iso-surfaces
|
|||
|
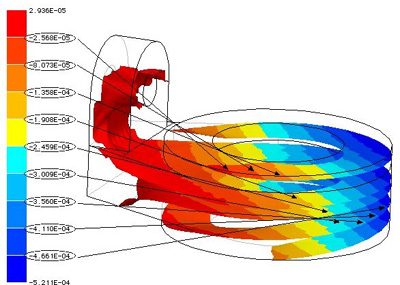
Setting the contour scale
|
|||
 |
|||
|
Scale bar
for contours on iso-surfaces
|
|||
|
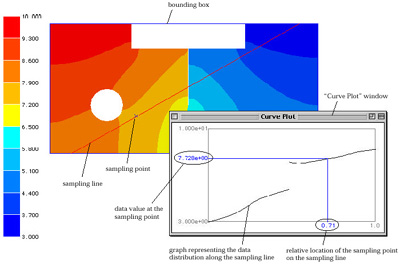
Curve plotting of scalar data
|
|||
 |
|||
|
Curve plotting
|
|||
|
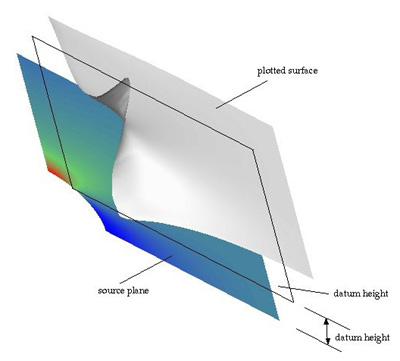
Surface plotting of scalar data
|
|||
 |
|||
|
Curve plotting
|
|||
|
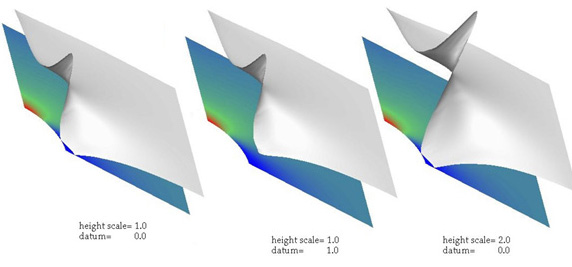
Setting the scale of height
|
|||
 |
|||
|
Comparison
of surface plotting with various height scale and datum
|
|||
|
Visualizing vector data by arrows
|
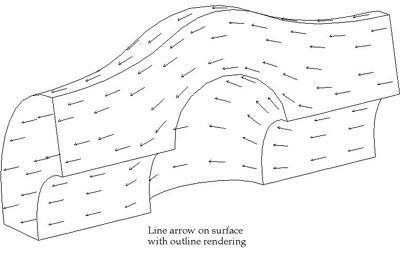
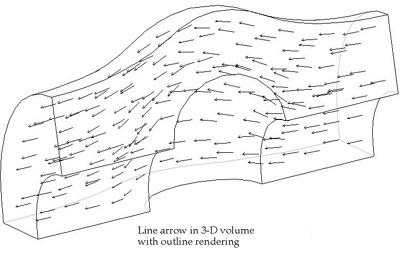
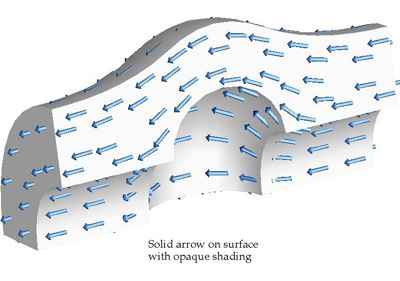
Selecting the style of surface or boundary surface
rendering
|
||
 |
|||
 |
|||
 |
|||
 |
|||
|
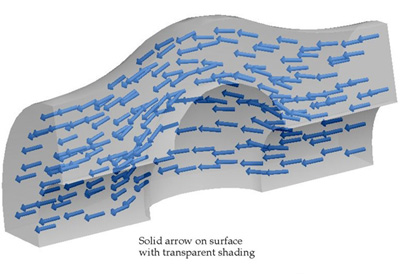
Type of arrow
and boundary surface rendering
|
|||
|
Setting the thickness of arrows
|
|||
 |
|||
|
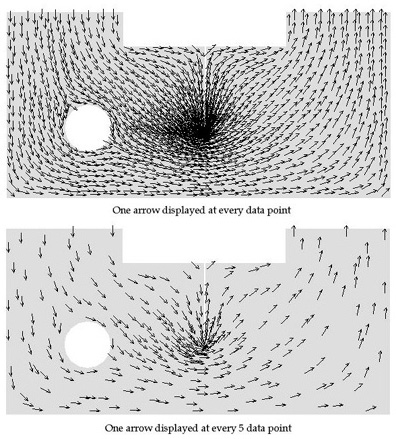
Displaying
selectively sampled arrows
|
|||
 |
|||
|
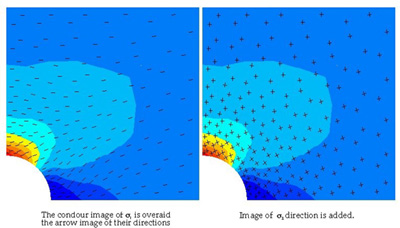
Overlaying
vector images
|
|||
|
Visualizing displacements by deformed shape
and animation
|
|||
 |
|||
|
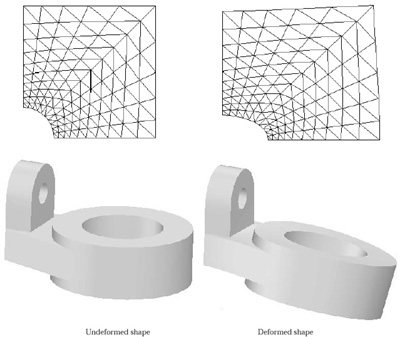
Deformed
shape of a planar structural model
|
|||
|
Stepwise rendering of sequentially staged
analysis results
|
|||
 |
|||
|
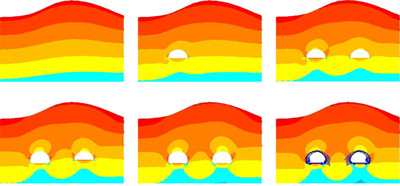
Multi-step
view of sequentially stage analysis results
|
|||
|
Visualization of scalar and vector data
|
|||
 |
|||
|
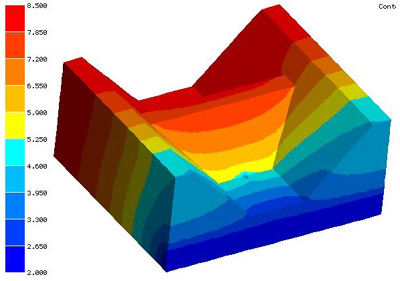
Vector representation
of flow velocity and directions
|
|||
|
Visualization of phreatic surface
|
|||
 |
|||
|
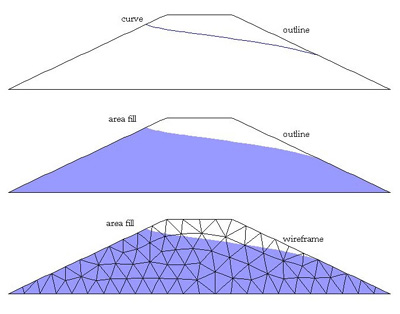
Comparison
of options for rendering of phreatic surface
|
|||
|
Rendering of the phreatic surface in 3-D seepage
analysis
|
|||
 |
|||
|
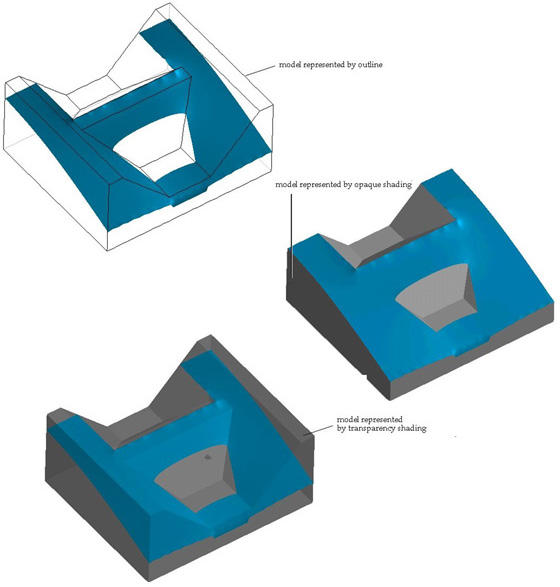
Rendering
of phreatic surface in 3-D seepage analysis
|
|||
|
Visualization of flow path
|
|||
 |
|||
|
Drawing flow path by clicking a point within the model |
|||
 |
|||
|
Dragging
the flow path
|
|||
|
Displaying multiple flow paths
|
|||
 |
|||
|
Displaying
multiple flow paths
|
|||
|
Overlaid display of flow paths
|
|||
 |
|||
|
Overlaid display of flow paths |
|||
|
Visualization of flow discharge
|
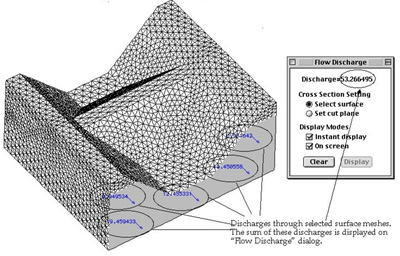
Getting flow discharge in a 3-D seepage model
|
||
 |
|||
|
Setting cross section by selecting surface meshes |
|||
|
Sequentially staged Analysis
|
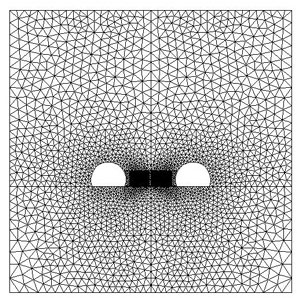
Tunnel 2D
|
||
 |
|||
|
2D Mesh
|
|||
|
Sequentially
staged Analysis (2D)
|
|||
|
Tunnel 3D
|
|||
|
Sequentially
staged Analysis (3D)
|
|||
|
Dynamic Analysis
|
Responses of bridege
|
||
|
Deformed Shape (Animation)
|
|||
|
|
|||
|
Dynamic Responce (Animation)
|
|||
|
|
|||
|
Normal Stress X (Animation) |
|||