![]()
| Postprocessing of Continuum Analysis > Visualizing Scalar Data by Iso-surface and others > Visualizing scalar data using iso-surfaces |
|
|
|
|
||
Visualizing scalar data using iso-surfaces
 |
Iso-surface representation is an efficient method of volume visualization, i.e., visualizing data distribution in 3-D space. Iso-surfaces within a 3-D volume are analogous to contours on surface. An iso-surface represents a surface in a 3-D volume, while a contour line represents a curve on plane or surface, on which all the points have equal data value. The 3-D model space is split by a number of iso-surfaces, and each of the split parts represents a region of the model with certain range of the data value. Thus, the overall data distribution in 3-D space can be grasped easily from the iso-surface image.
|

<Comparison of contour and iso-surface images>
> Setting the iso-surface display options
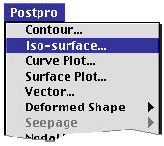
In oder to get an iso-surface image of a data set, first select "Iso-surface..."
items from ![]() menu.
Then, "Iso-surface Display" dialog appears on the scre e n . This
dialog is similar to "Contour Display" dialog described in the preceding
chapters. However, "Iso-surface Display" dialog has more items than
"Contour Display" dialog. There are a number of items in this dialog.
Each item has default setting. Change the setting if necessary. You may also
specify the scale of contour bands as well as iso-surfaces. Click button if
every item is set as desired. Then, the iso-surface image will be displayed
with a scale bar which indicates the data value re p resented by each one of
the isosurfaces.
menu.
Then, "Iso-surface Display" dialog appears on the scre e n . This
dialog is similar to "Contour Display" dialog described in the preceding
chapters. However, "Iso-surface Display" dialog has more items than
"Contour Display" dialog. There are a number of items in this dialog.
Each item has default setting. Change the setting if necessary. You may also
specify the scale of contour bands as well as iso-surfaces. Click button if
every item is set as desired. Then, the iso-surface image will be displayed
with a scale bar which indicates the data value re p resented by each one of
the isosurfaces.
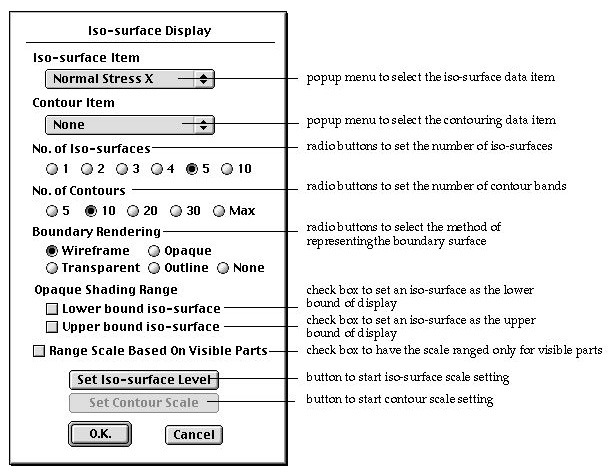
< "Iso-surface Display" dialog >
> Selecting the data item to be represented by iso-surfaces
There are two popup menus in "Iso-surface Display" dialog. The data item for isosurfacebrepresentation is selected using the first popup menu, which has the same menu items as the one in "Contour Display" dialog. (Refer to "Visualizing Scalar Data by Contours" section of this chapter.) Only available data items are listed in the menu.
> Selecting the data item to be represented by contours
Iso-surfaces may be painted with contour bands which represent distribution of another data item. For example, iso-surfaces represent the distribution of normal stress sx, and contours represent the distribution of shear stress txy. The second popup menu has the menu items to select the contour data item, and has one more item "None" than the first popup menu for iso-surfaces. The popup menu is initially set as "None" which designates no contour on the iso-surfaces. Thus each of the iso-surfaces is rendered in one color corresponding to the isosurface level.

< Popup menus in "iso-surface Display" dialog >
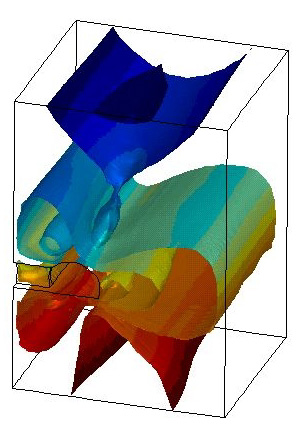
<Iso-surface image with contour>
> Setting the number of iso-surfaces
The number of iso-surfaces can be set by clicking the radio button labeled with the desired number. There are 6 radio buttons under "No, of Iso-surface": "1", "2", "3", "4", "5" and "10". The number of iso-surfaces is initially set as 5 by default. The rendering time depends on the number of surfaces, and increases significantly as the number of iso-surfaces increases.
> Setting the number of contour bands
In case contours are to be drawn on the iso-surfaces, the number of contours should be determined. The number of contour bands is initially set as 10 by default. This default setting can be changed by clicking the radio button labeled with the desired number of bands, which should be one of 5, 10 , 20, 30 and Max. If you choose "Max" the contour image will be rendered with as many bands as possible using the available colors. The number of contours has no effect on the rendering time.
> Selecting the type of boundary surface rendering
Iso-surfaces are contained within 3-D volumes surrounded by boundary surfaces. In order to enhance the visual understanding, it is desirable to display the surrounding boundary surfaces together with iso-surfaces. There are a few different types of rendering the boundary surface, one of which should be chosen:
|
"Wireframe" : The boundary surfaces are rendered in the form of wireframe. The hidden lines are removed from the wireframe rendering. |
|
|
"Opaque" : The boundary surfaces are rendered in the form of the volume surrounded by the specified upper bound or/and lower bound iso-surfaces. If this option is on, the check boxes under "Opaque shading range" are automatically checked. On the other hand, this option is automatically on if the check boxes are checked. |
|
|
"Transparent" : The boundary surfaces are rendered in transparency shading. Iso-surfaces are rendered as opaque objects surrounded by transparent boundary surfaces. |
|
|
"Outline" : The outlines of the boundary surfaces are extracted, and represented together with the iso-surfaces. |
|
|
"None" : The iso-surface image is displayed without boundary surface rendering. |
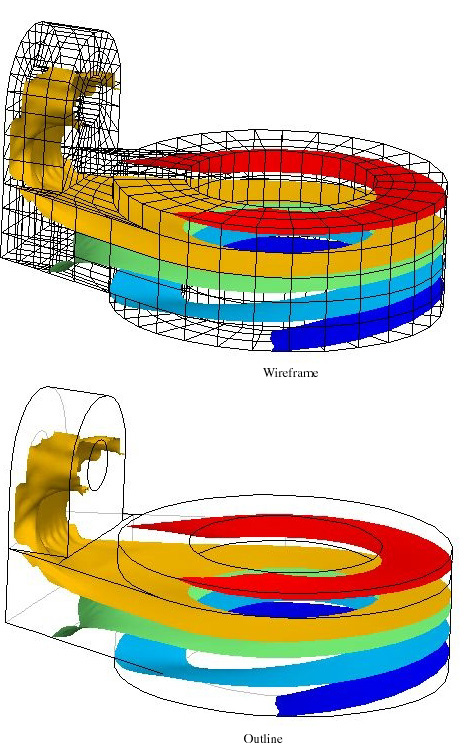
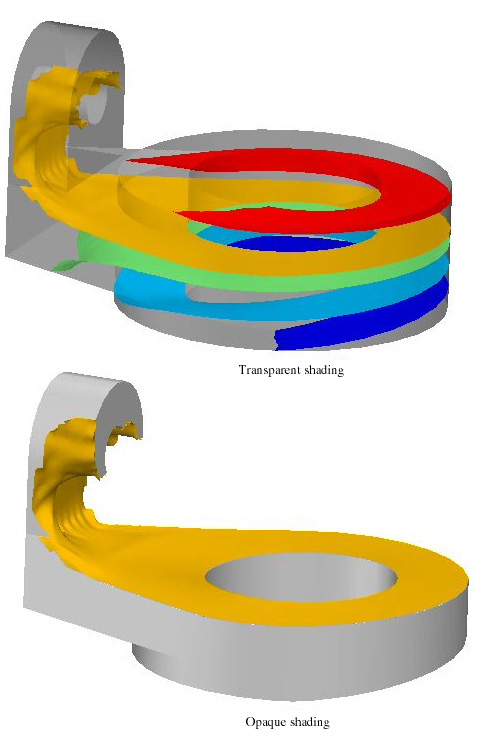
< Boundary surface rendering with iso-surfaces >
> Designating the iso-surfaces as the boundary of a truncated model
Iso-surfaces may also be used as boundary surfaces isolating a part of the model with a certain range of data values. There are two check boxes under the heading of "Opaque shading range", "Lower bound iso-surface" and "Upper bound isosurface" Any one or both of the two may be checked. The checked item will be followed by editable text items to enter an iso-surface by its number as the upper bound or the lower bound surface of the truncated model. If any one of the boxes is checked, the option for boundary surface rendering will be automatically switched to "Opaque" if it is not.
There are following 3 possibilities of truncating the model by use of:
|
lower bound iso-surface only. |
|
|
upper bound iso-surface only. |
|
|
both lower and upper bound iso-surfaces. |
Model rendering in the above 3 cases are 1 in the figure below.
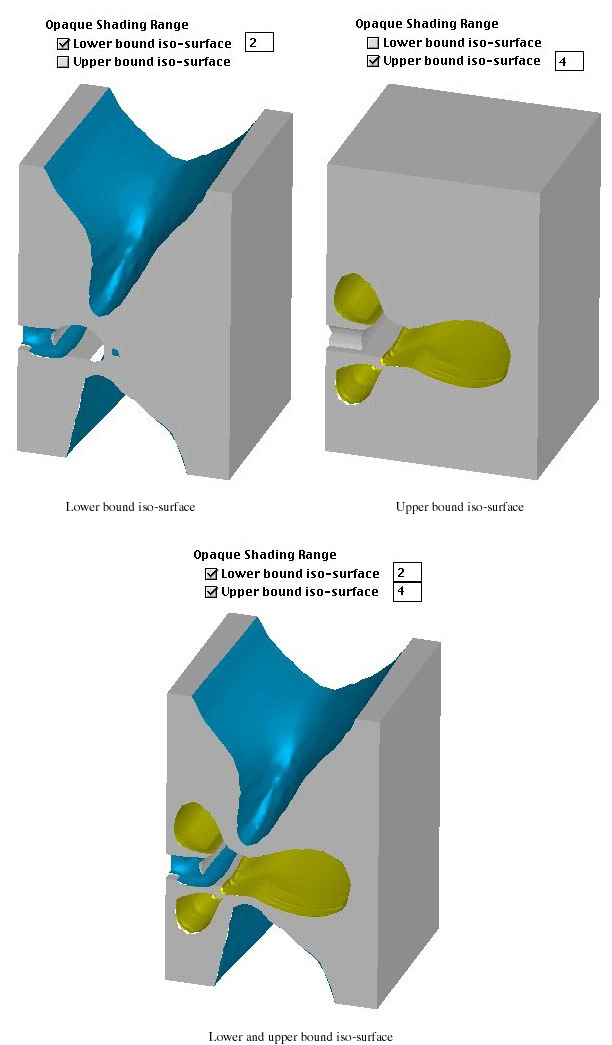
< Model truncated by iso-surfaces >
> Limiting the range of iso-surface scale by actually displayed values
Levels of iso-surfaces are determined by the differences between the maximum and the minimum values of the data to be visualized. In case iso-surfaces are defined only within the selected parts or within the visible parts of the model, it is better to determine the iso-surface level based on the range of data values in the visualized parts only rather than that of the whole model. This adjustment of the data range can be achieved by checking the box labeled "Range Scale Based On Visible Parts".
> Setting the iso-surface level
An iso-surface splits the model into two regions, one with data value just
above and the other just under the data value represented by the iso-surface.
This data value is termed here as iso-surface level. Each of the iso-surface
levels has a value between the maximum and minimum values of the data to be
visualized. The isosurface levels are initially determined by the software,
but can be altered as desired in the same manner as changing the contour scales
described in the previous section. In order to start setting the iso-surface
levels, first click ![]() button
in "iso-surface Display" dialog. Then, "Contour Scale" dialog
will appear on the screen. This is the identical dialog used for setting the
contour scale.
button
in "iso-surface Display" dialog. Then, "Contour Scale" dialog
will appear on the screen. This is the identical dialog used for setting the
contour scale.
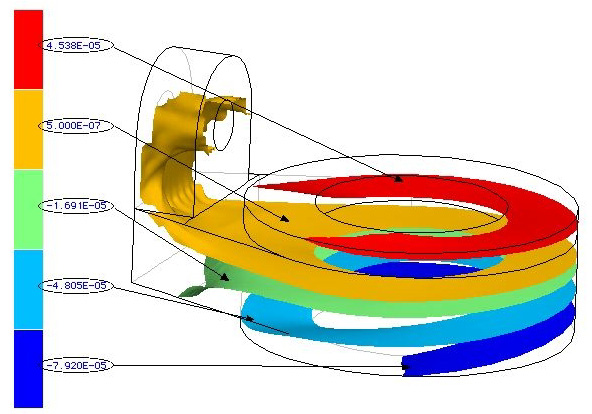
< Scale bar for iso-surfaces >
> Setting the contour scale
In case the iso-surfaces are displayed with contours, the data re p resented
by the contours are scaled independently from that of the iso-surface. In order
to adjust the contour scale, first click ![]() button
in "Iso-surface Display" dialog. Then, "Contour Scale" dialog
will appear on the screen. The contour scale values can be set by using this
dialog.
button
in "Iso-surface Display" dialog. Then, "Contour Scale" dialog
will appear on the screen. The contour scale values can be set by using this
dialog. ![]() button is enabled only when the second popup menu of "iso-surface Display"
dialog is set to a data item other than "None" Otherwise, this button
is dimmed.
button is enabled only when the second popup menu of "iso-surface Display"
dialog is set to a data item other than "None" Otherwise, this button
is dimmed.
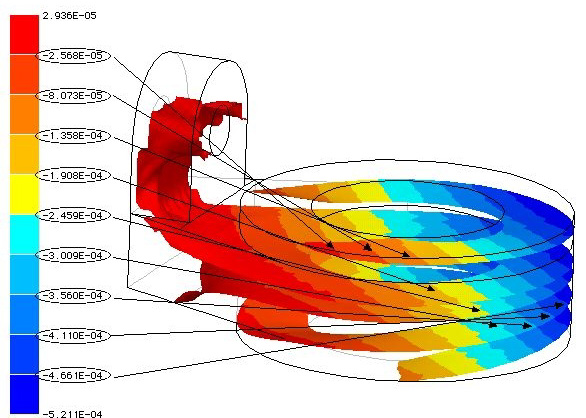
< Scale bar for contours on iso-surfaces>
|
|
|
|