![]()
| Postprocessing of Continuum Analysis > Visualizing Scalar Data by Iso-surface and others > Surface plotting of scalar data |
|
|
|
|
||
Surface plotting of scalar data
 |
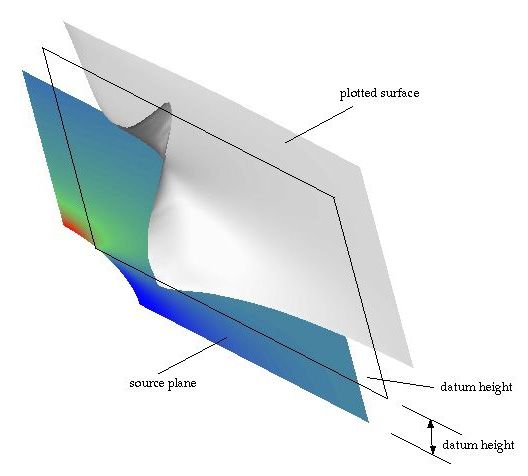
Surface plotting is a method of visualizing 2-dimensional scalar data distribution by a 3-dimensionally rendered surface over the data plane. The magnitude of the data at a point is represented by the height of the surface at that point. Surface plotting involves two surfaces, the source plane and the plotted surface. The source plane is the actual plane, the data on which are to be visualized. The plotted surface is the numerically constructed surface representing the data distribution. The datum of the plotted surface and the scale of the height can be set as desired. The surface is rendered as a smooth and continuous surface in a few different forms. This method is also supplementary to contouring, but not necessarily preceded by contouring. This function is appropriate only for visualizing data on 2-D planes. |

< Surface plotting >
> Setting the surface plotting options
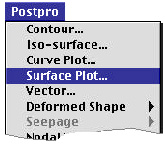
In oder to get surface plotting image for a scalar data set, first select "Surface
Plot..." items from ![]() menu.
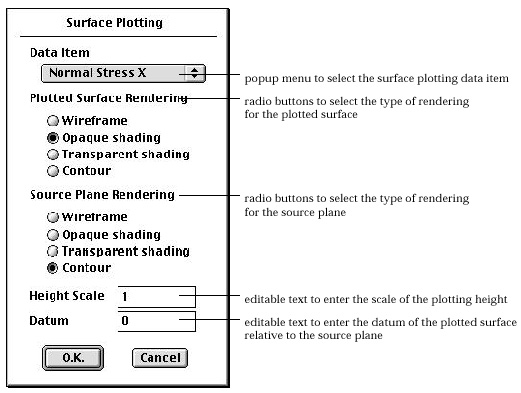
Then, "Surface Plotting" dialog appears on the screen as shown in
the following figure. There are a number of items in this dialog. Each item
has default setting. Change the setting if necessary. Click
menu.
Then, "Surface Plotting" dialog appears on the screen as shown in
the following figure. There are a number of items in this dialog. Each item
has default setting. Change the setting if necessary. Click ![]() button
if every item is set as desired. Then, the surface plotting image will be displayed.
button
if every item is set as desired. Then, the surface plotting image will be displayed.

< "Surface Plotting" dialog >
> Selecting the data item
The popup menu in "Surface Plotting" dialog has the list of data items which can be displayed by surface plotting. They are identical to the popup menu item in "Contour Display" dialog. One of the items should be selected from this popup menu. The data associated with the currently selected popup menu item are displayed by surface plotting.
> Selecting the type of rendering for the plotted surface
The plotted surface can be rendered in one of the following 4 different forms. Select the type of the rendering by turning on one of the following radio buttons under the heading, "Plotting Surface Rendering".
|
" Wireframe" : The plotted surface is rendered in the form of a wireframe. Hidden lines are removed from the wireframe rendering. |
|
|
"Opaque shading" : The plotted surface is rendered by opaque shading. |
|
|
"Transparent shading" : The plotted surface is rendered by transparent shading. |
|
|
"Contour" : The plotted surface is rendered by a contoured surface. |
> Selecting the type of rendering for the source plane
The source plane can also be re n d e red in one of the following 5 different forms. Select the type of the rendering by turning on one of the following radio buttons under the heading, "Source Plane Rendering".
|
"Wireframe" : The source plane is rendered in the form of wireframe. |
|
|
"Opaque shading" : The source plane is rendered by opaque shading. |
|
|
"Transparent shading" : The source plane is rendered by transparent shading. |
|
|
"Contour" : The source plane is rendered by a contoured surface. |
|
|
"None" : The source plane is not displayed. |
> Setting the scale of height
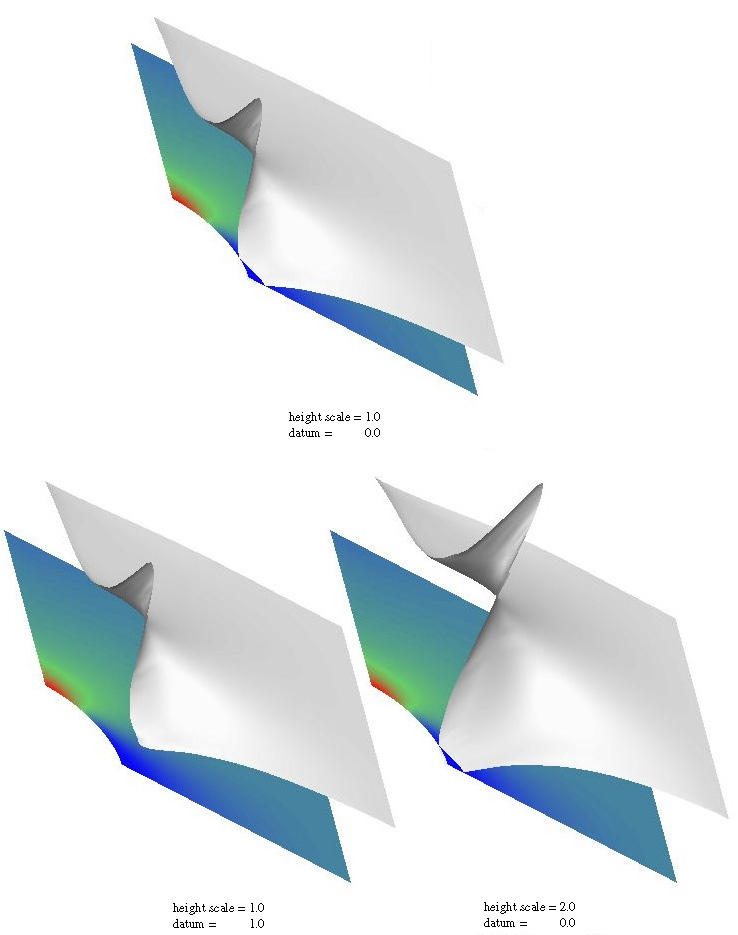
In surface plotting, the magnitude of a data value is represented by the height of the plotted surface over its datum. The scale of height implies the height re p resenting a unit magnitude, and is entered in the editable text box labeled as "Height Scale".
> Setting the datum of the plotted surface
The datum of the plotted surface implies the reference from which the height of the plotted surface is measured. The datum is entered in the editable text box labeled as "Datum". The default value of the datum is 0, and thus, the plotted surface touches the source plane at the point of zero value.

< Comparison of surface plotting with various height scale and datum >
|
|
|
|