![]()
| Postprocessing of Continuum Analysis > Visualizing Vector Data > Visualizing vector data by arrows |
|
|
|
|
||
Visualizing vector data by arrows
 |
Arrows are usually used to visualize vector data. The magnitude of the data is represented by their lengths, and the direction of the data by arrow-head directions. In case of 3-dimensional solid analysis, arrows may be rendered as 3-dimensional solid objects. The following figure shows an example of ground water flow analysis, in which the flow directions are represented by arrows. In this example, an arrow indicates only the direction of the flow at the point, but not magnitude. So, the arrow length has no significance. |
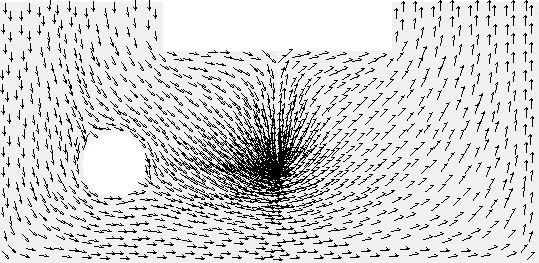
< Ground water flow directions represented by arrows >
> Setting the arrow display options
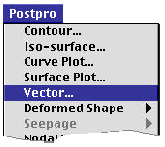
In oder to get arrow image of a vector data set, first select "Vector..."
items from ![]() menu.
Then, "Arrow Display" dialog appears on the screen as shown in the
following figure. There are a number of items in this dialog. Each item has
default setting. Change the setting if necessary. Click
menu.
Then, "Arrow Display" dialog appears on the screen as shown in the
following figure. There are a number of items in this dialog. Each item has
default setting. Change the setting if necessary. Click ![]() button
if every item is set as desired. Then, the arrow image will be displayed.
button
if every item is set as desired. Then, the arrow image will be displayed.
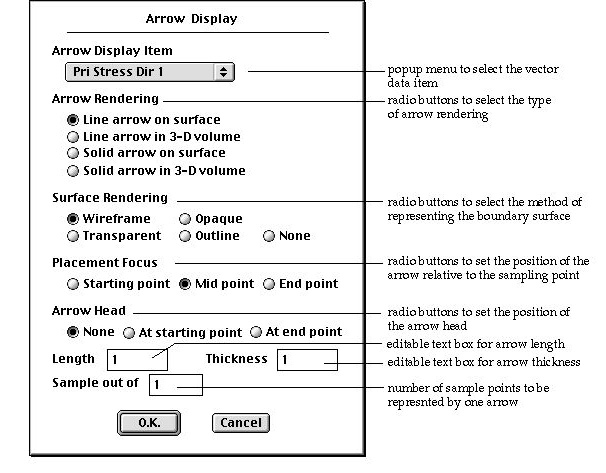
<"Vector Display" dialog >
> Selecting the data item
The popup menu in "Vector Display" dialog has the list of data items which can be displayed by arrow representation. One of the items should be selected from this popup menu. The data associated with the currently selected popup menu item is displayed by arrow image. The first item is always selected initially when the "Arrow Display" dialog is first opened. But the item used for the last arro w display will be selected automatically when the dialog is opened next. The popup menu items vary depending on the analysis type. Only those output items appropriate for vector display appear on the popup menu. They are shown below. Not all the items are always shown in the popup menu. If you exclude any of the output items in "Analysis Options" dialog described in Chapter 6, the corresponding item(s) will not be shown. If you are using an external solver, the menu items may be different from those shown below, because the popup menu items can be customized by the external solvers.
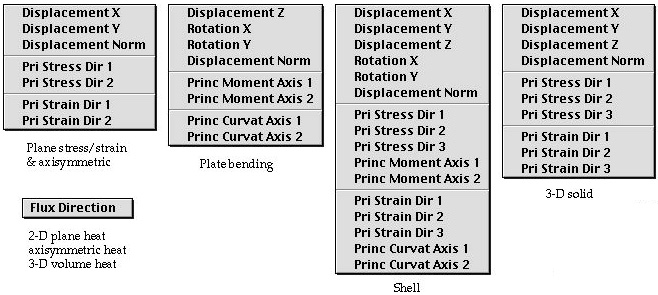
< Popup menu selecting the arrow display data item >
> Selecting the type of arrow rendering
Arrows may be rendered in 3 different types. Select one of the types by turning on the corresponding radio button.
|
"Line arrow on surface" : Arrows are drawn as lines with or without arro w head. Arrows represent the vector data on planes or surfaces. |
|
|
"Line arrow in 3-D volume" : Arrows are drawn as lines, but re p resent the vector data with 3-D volumes. This type is applicable only to 3-D volume models. |
|
|
"Solid arrow on surface" : Arrows are rendered as 3-D solid objects on plane or surface. Arrows represent the vector data on planes or surfaces. |
|
|
"Solid arrow in 3-D volume" : Arrows are rendered as 3-D solid objects within 3-D volume. Arrows represent the vector data on planes or surfaces. This type is applicable only to 3-D volume models. |
|
|
<Popup menu selecting the arrow display data item > |
> Selecting the style of surface or boundary surface rendering
The arrows are usually rendered together with the surfaces on which the arrows lie, or the boundary surfaces of the volumes containing the arrows. Select the style of the surface rendering by turning on one of the following radio buttons in "Vector Display" dialog:
|
"Wireframe" : The boundary surfaces are rendered in the form of wireframe. The hidden lines are removed from the wireframe rendering. |
|
|
"Opaque" : The boundary surfaces are rendered by opaque shading. If the type of arrow rendering is set to "Solid arrow in 3-D volume" this option is not applicable, and thus "Opaque" button is disabled. |
|
|
"Transparent" : The boundary surfaces are rendered in transparency shading. This option is useful if the type of arrow rendering is set to "Line arrow in 3-D volume" or "Solid arrow in 3-D volume". |
|
|
"Outline" : The outlines of the boundary surfaces are extracted, and represented together with the arrow image. |
|
|
"None" : The arrow image is displayed without boundary surface rendering. This option may be used to overlay the arrow image over the existing screen image. |
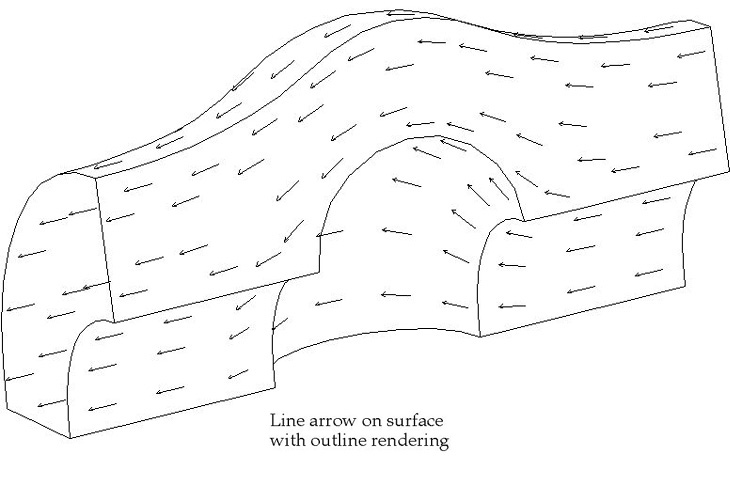
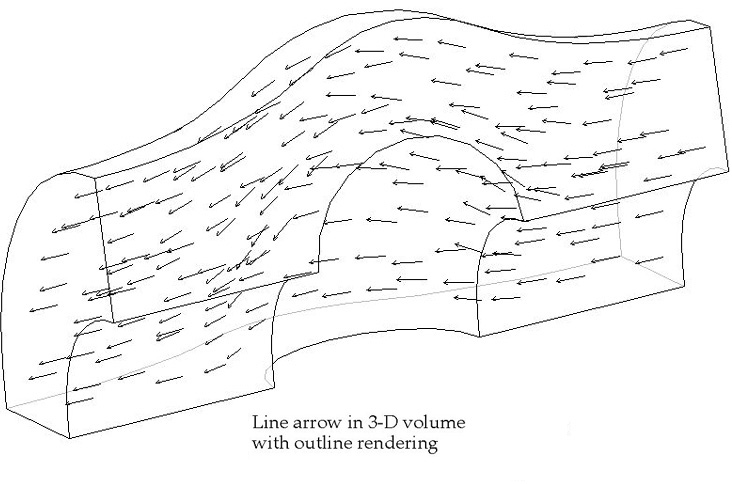
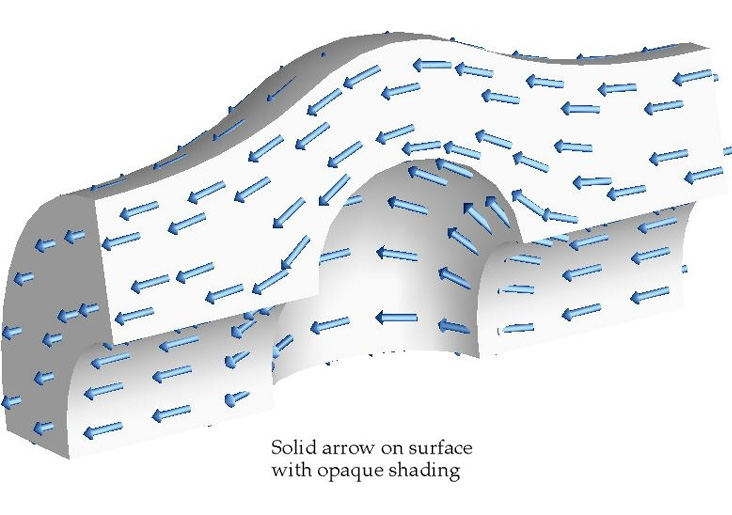
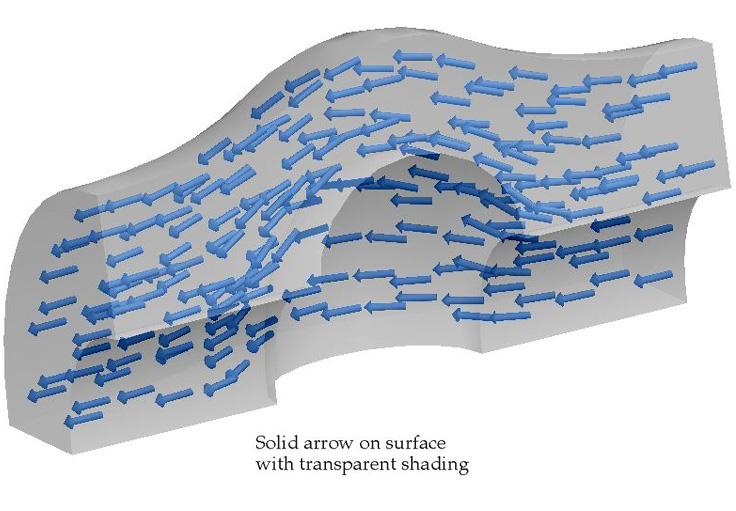
< Type of arrow and boundary surface rendering>
> Setting the placement focus of arrows
An arrow may be placed at various positions relative to its data point. The placement focus of an arrow implies the position of the arrow, which matches with the data point, and can be set as one of the following options:
|
"Starting point" : The starting point of an arrow is set as the placement focus. |
|
|
"Aid point" : The midpoint of an arrow is set as the placement focus. |
|
|
"End point" : The end point of an arrow is set as the placement focus. |
|

< Arrow placement >
> Setting the position of arrow heads
An arrow can be drawn either with or without arrow head. At the same time, the arrow head may be attached at the starting point or the ending point of the arrow. Thus, there are the following 3 options related to arrow heads:
|
"None" : Arrow heads are not drawn. An arrow is represented by a straight line. This option is appropriate for the case in which the sign of the direction is not important. For example, the directions of principal stresses are usually drawn without arrow heads. |
|
|
"At starting point" : The arrow head is attached to the starting point of the arrow. The arrow directs from the end point toward the starting point. This option is used to draw the arrow in the directions reverse to the actually computed ones. |
|
|
"At end point" : The arrow head is attached to the end point of the arrow. The arrow directs from the starting point toward the end point. The vector directions are normally represented by this option. |
|
|
< Arrow head position > |
> Setting the length of arrows
The length of an arrow may or may not represent the magnitude of its corresponding data value, depending on whether the corresponding vector data have magnitude or not. For example, displacements in structural analysis have magnitudes as well as directions. But, there are such vector data as principal stress directions for example, in which the data has only direction, not magnitude. In either case, the length of the arrow is determined on the basis of the predefined length factor. The length factor is defined by entering its value in the editable text box labeled "Length" in the dialog. The entered value should be greater than 0, and represents a factor determining the arrow length. The length is independent of the view scale of the model. Thus, the length of arrow remains unchanged even if the screen scale is altered.

< Length and thickness of arrow >
> Setting the thickness of arrows
This item is effective only for "Solid arrow in 3-D volume" option. The length of the arrow rendered as 3-D solid is determined on the basis of the predefined thickness factor. The thickness factor is defined by entering its value in the editable text box labeled "Thickness" in the dialog. The entered value should be greater than 0, and represents a factor determining the arrow thickness. The thickness is independent of the view scale of the model. Thus, the thickness of arrow remains unchanged even if the screen scale is altered.
> Displaying selectively sampled arrows
One arrow is usually displayed at every data point, which may be a node or a point in an element. As the model becomes complex, the number of data points increases. Sometimes, there are too many arrows crowded around a point to visualize the data properly. Such complexity in visualization can be alleviated by displaying the arrows partially. The proportion of arrows for selective display is designated by the value entered in in the editable text box labeled "Sampling out of" in the dialog. If the value is 1, one arrow is displayed at every data point. In other words, all the arrows will be displayed. If it is 5 for example, arrows are displayed only at one out of 5 data points.
> Overlaying vector images
It is sometimes necessary to overlay two or more vector images. For example, the directions of two principal stresses, s1 and s2, are desired to be displayed together in order to improve the visual understanding of the computed results. In this case, the directions of s1 are first drawn, and those of s2 are overlaid over the existing image. Such overlaying vector images can easily be achieved by using "None" option for surface rendering. This option adds the new vector image over the previously drawn image.
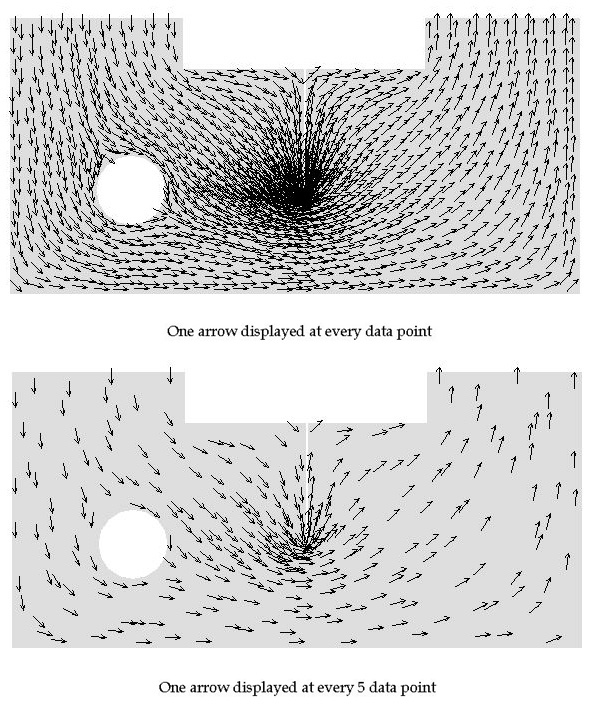
< Displaying selectively sampled arrows >
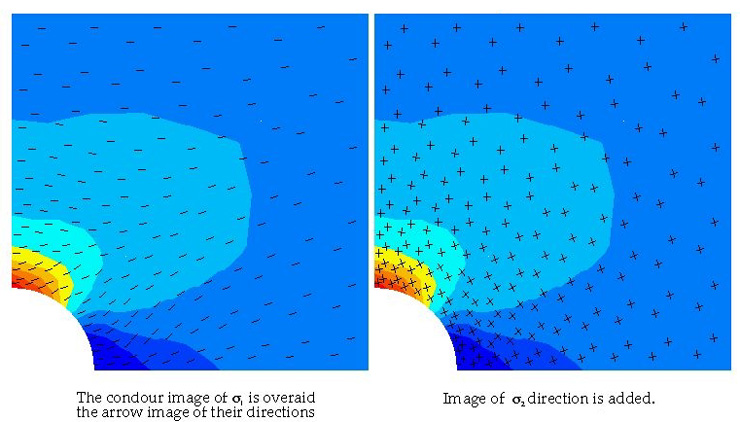
< Overlaying vector images >
|
|
|
|