![]()
| Postprocessing of Continuum Analysis > Visualization of Dynamic Analysis Data > Visualizing dynamic response |
|
|
|
|
||
Visualizing dynamic response
The dynamic analysis results can be visualized by multi-step view as described in the preceding section. On the other hand, these data can also be organized into transient variation, i.e. time history of a certain response in the dynamic system.
> Visualizing dynamic analysis results using multi-step view
Multi-step view is used in visualizing the dynamic analysis data along the
time steps. Select "Multi-step View" item from ![]() menu.
Then, "Multi-step View" dialog appears on the screen. Using the control
buttons of this dialog, the analysis data can be rendered step by step,
menu.
Then, "Multi-step View" dialog appears on the screen. Using the control
buttons of this dialog, the analysis data can be rendered step by step,

> Visualizing dynamic analysis results in time history form
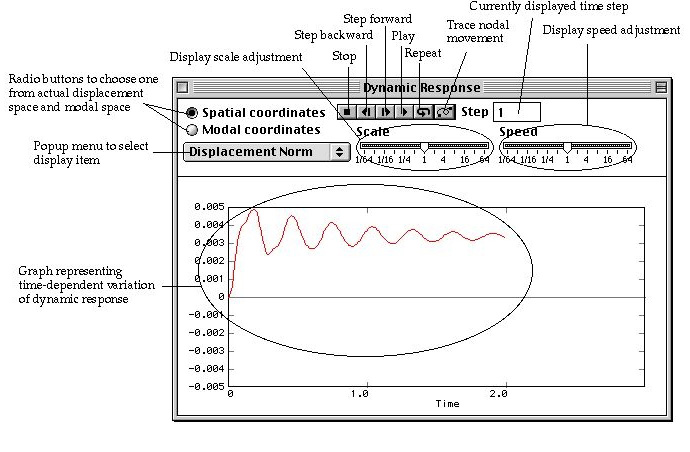
< An example of time history plot >
| Control buttons: | ||
|
- Stop button |
||
|
- Step backward button |
||
|
- Step forward button |
||
|
- Play button |
||
|
- Repeat button |
||
|
- Trace button |
||
|
Step text box : This editable text item shows the currently displayed time step. The time step can be moved directly by editing this editable text. |
||
| Mode text box : This editable text item shows the number of the currently displayed dynamic mode. The dynamic mode can be altered directly by editing this editable text, or by using scroll button to the right of this text box. This text item is visible only when "Modal coordinates" radio button is turned on. | ||
|
Slide control of scale : The scale of dynamic motion or dynamic mode is adjusted by using this control. |
||
|
Slide control of speed : The speed of animation is adjusted by using this control. |
||
|
Radio buttons: There are 2 radio buttons to set the type of time history. |
||
|
- "Spatial coordinates" : The time history is expressed directly by nodal values of displacements, velocity and acceleration. |
||
|
- "Modal coordinates" : The time history is expressed by linear combination of modal coordinates for displacements, velocity and acceleration. |
||
|
Popup menu: The menu consists of display items. The contents of the time history plot are altered by changing the menu item. |
||
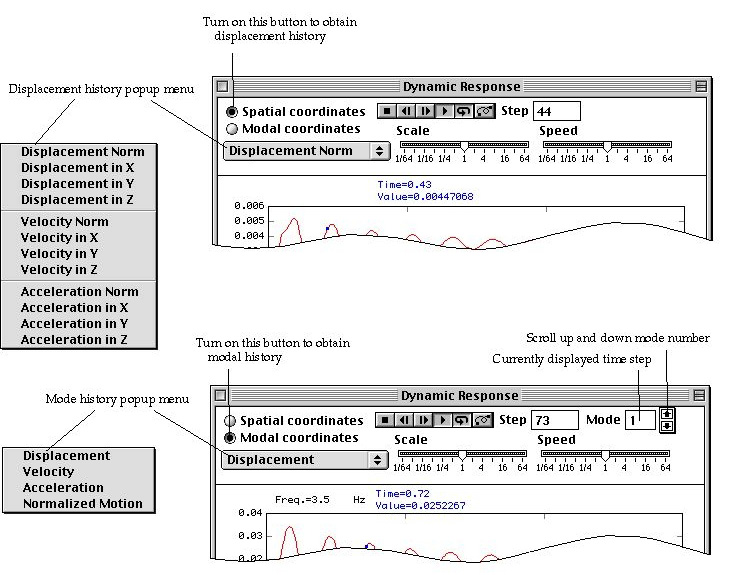
<Selection of coordinates for plotting dynamic response>
> Plotting time history records of nodal value in spatial coordinates
In case "Spatial coordinates" radio button is on, a nodal value changing as a function of time is plotted on "Dynamic Response" window. The nodal value represents one of displacement, velocity, acceleration, and their components which have been recorded for each time step of dynamic analysis. The following is the procedure of visualizing the time history of a nodal value.
|
1) Select ""Dynamic Response" item from |
|
|
Time history window pops up. |
|
|
2) Turn on "Spatial coordinates" radio button, if it is not. |
|
|
Initially this radio button is on by default. While this button is on, the popup menu contains the items relevant to displacement time history. |
|
|
3) Select the node whose record is to be displayed. |
|
|
The node for time history plot is not specified at the beginning, and thus "Dynamic Response" window show the message "Select the node for time history record". At the moment a node is selected from the model, the time history record of the node is plotted on "Dynamic Response" window. |
|
|
4) Select the popup menu item to change the displayed data item. |
|
|
The popup menu contains following items which re p resent the types of the data record. |
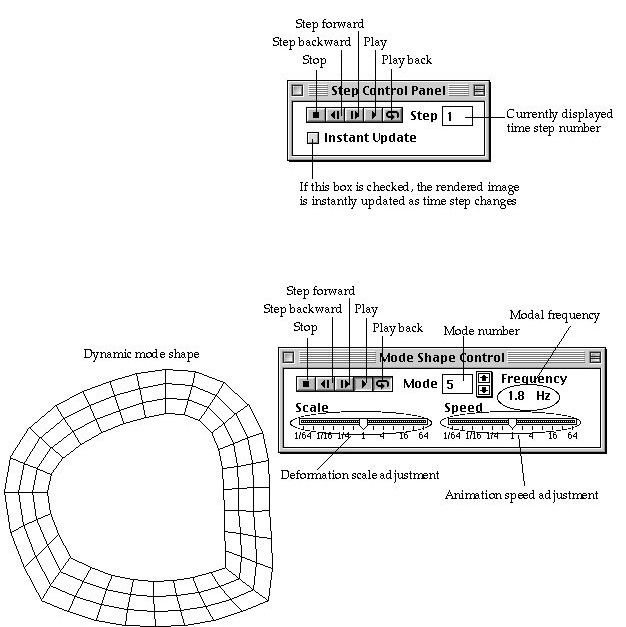
<Time history plot in spatial coordinates>
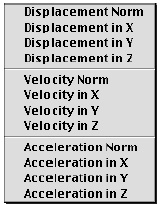 |
- "Displacement Norm" : magnitude of displacement. |
|
- "Displacement in X" : displacement component in X direction. |
|
|
- "Displacement in Y" : displacement component in Y direction. |
|
|
- "Displacement in Z" : displacement component in Z direction. |
|
|
- "Velocity Norm" : magnitude of velocity. |
|
|
- "Velocity in X" : velocity component in X direction. |
|
|
- "Velocity in Y" : velocity component in Y direction. |
|
|
- "Velocity in Z" : velocity component in Z direction. |
|
|
- "Acceleration Norm" : magnitude of Acceleration. |
|
|
- "Acceleration in X" : Acceleration component in X direction. |
|
|
- "Acceleration in Y" : Acceleration component in Y direction. |
|
|
- "Acceleration in Z" : Acceleration component in Z direction. |
The time history record of the specified data item at the selected node is plotted on "Dynamic Response" window. The plot has horizontal axis for time and the vertical axis for magnitude of nodal value. The scales of horizontal and vertical axes are determined automatically so that the plotted graph makes the best of the space on "Dynamic Response" window.
> Plotting time history records in modal coordinates
In case the dynamic solution is obtained by the method of mode superposition, the modal coordinates are recorded for each time step of the analysis. The record of the modal coordinates can be plotted against time by the following steps:
|
While the plotting of modal coordinates is shown on "Dynamic Response" window, the motion of the corresponding dynamic mode is displayed on the main window. |
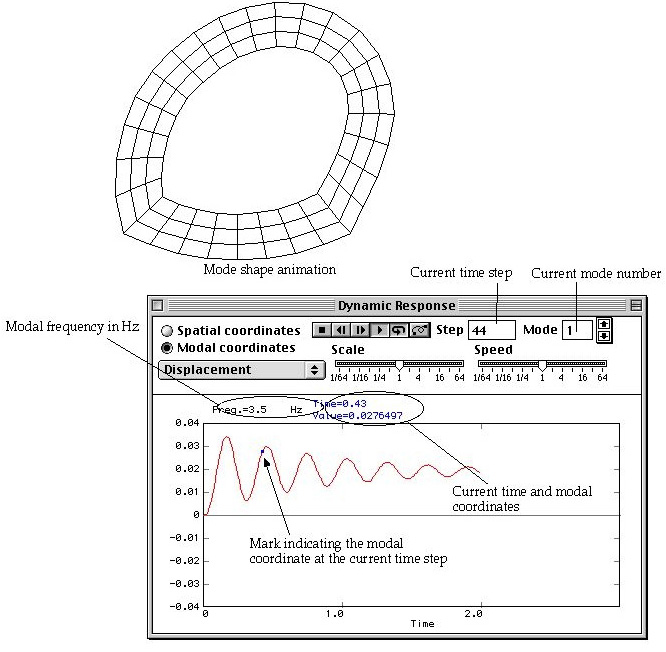
<Dynamic response plot in modal coordinates>
> Animation of dynamic motion
The dynamic motion of the model can be animated in coupling with the nodal
value plotted on "Dynamic Response" window. The animation is initiated
by clicking the play button ![]() of
the window, and proceeds one frame for every time step while the button is in
pressed state
of
the window, and proceeds one frame for every time step while the button is in
pressed state ![]() .
The animation is terminated when the frame moves to the last time step, and
the play button returns to unpressed state. If the playback button is in pressed
state
.
The animation is terminated when the frame moves to the last time step, and
the play button returns to unpressed state. If the playback button is in pressed
state![]() ,
the animation continues with the time frame progressing forward and backward
alternately. While animation is running on the main window, the nodal value
plot corresponding to the currently displayed animation frame is marked by a
small square mark on "Dynamic Response" window.
,
the animation continues with the time frame progressing forward and backward
alternately. While animation is running on the main window, the nodal value
plot corresponding to the currently displayed animation frame is marked by a
small square mark on "Dynamic Response" window.
In case of mode history plotting, the motion of a dynamic mode is animated in coupling with the modal coordinates plotted on "Dynamic Response" window.
> Displaying the trace of nodal movement
If trace display button ![]() is
in pressed state
is
in pressed state ![]() ,
the trace of a nodal movement is recorded and displayed while the animation
is going on. In order to remove the trace, turn the button
,
the trace of a nodal movement is recorded and displayed while the animation
is going on. In order to remove the trace, turn the button ![]() to
unpressed state by clicking the button
to
unpressed state by clicking the button ![]() .
.
> Changing the time step
While animation of dynamic motion is going on, time also progresses and the time step number is reflected in the step text box. The time step can also be changed by using step forward button or step backward button .
The time step can also be changed by editing directly the number in the step text box. As soon as the step number is altered, the image of dynamic motion is updated to the frame of corresponding time step.
> Dragging the time step
The time step representing the currently displayed animation frame can be moved forward or backward by dragging the square mark on the nodal value plot. The current time step changes along with the movement of the mark. This action can be achieved by the following procedure.
|
1) Place the cursor over the square mark and press the mouse button. |
|
|
A vertical line is drawn to indicate that dragging is started. Animation is paused, if it is running. |
|
|
2) Drag the mark with mouse button pressed. |
|
|
The vertical line as well as the mark moves along with the mouse movement. The time step also changes as the mark moves. The image of the model on the main window is also updated in accordance with the motion at the time step. |
|
|
3) Release the mouse button. |
|
|
Dragging is completed, and animation is resumed if it was running before the start of dragging. Depending on the direction of dragging, the progress of time is also altered either into forward or backward direction. |
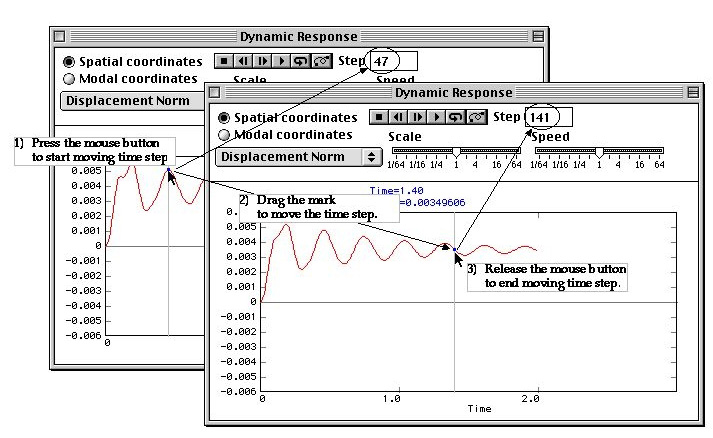
<Moving the time step by dragging>
> Adjusting the animation speed and the deformation scale
Dynamic motion or dynamic mode is animated with the speed and the deformation scale optimally determined by the software. This speed and the scale can be adjusted using the slide controls provided on "Dynamic Response" window.
> Resizing "Dynamic Response" window
"Dynamic Response" window can be resized by dragging size box(Mac OS) or window border lines(MS Windows). A subsequent time history image is drawn to fit the resized window.
> Ending time history display
Time history display mode is going on while "Dynamic Response" window is open, and can be terminated by closing the window or by starting other menu command.
|
|
|
|