![]()
| Postprocessing of Continuum Analysis > Visualization of Dynamic Analysis Data > Visualizing dynamic mode shape |
|
|
|
|
||
Visualizing dynamic mode shape
The dynamic motion can be decomposed into a number of dynamic modes, which a re extracted by eigenvalue analysis of the dynamic system. Data related to dynamic modes are also important ingredients of dynamic analysis. The shape of dynamic modes can be represented by deformed shape or animation. In order to visualize dynamic modes, the system should be solved with "Mode superposition" or "Modal analysis" option in "Dynamic Analysis Options" dialog.
> Starting and controlling mode shape display

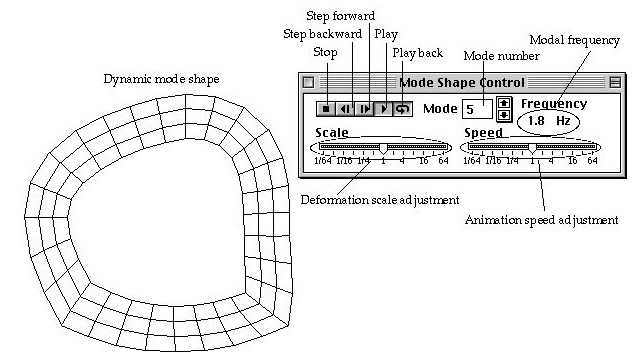
<Display of dynamic mode shapes>
> Selecting the mode to display
The dynamic modes are numbered in ascending order of their frequencies, i.e., smaller number for lower frequency and larger number for higher frequency. The mode for display is selected by its number. The number of the currently displayed mode is shown in the text box of the dialog. The number can be picked by directly editing the text or by using scroll buttons. As soon as the mode number is altered, the shape of the corresponding mode is displayed on the main window, and the frequency of the mode is indicated on "Mode Shape Control" dialog.
> Scale of display
The mode shape is displayed with the deformation scale optimally determined by the software. The scale can be adjusted by using a slide control of the dialog.
> Speed of animation
The speed of animation, i.e., the number of frames proceeding per second is initially determined by the software. The speed can be adjusted by using a slide control of the dialog.
> Ending dynamic mode display
Dynamic mode display mode is going on while "Mode Shape Control" dialog is open, and can be terminated by closing the window or by starting another menu command.
|
|
|
|