![]()
| Postprocessing of Continuum Analysis > Visualizing Scalar Data by Contours > Setting the contour scale |
|
|
|
|
||
The contour scale is determined automatically on the basis of the number of
contour bands, and the minimum and the maximum values of the data to be contoured.
The gap between the maximum and minimum values is equally divided by the number
of contour bands so that the intervals of adjacent two scale values are uniform.
However, the scale values can be adjusted as desired. In order to adjust the
contour scale, first click ![]() button
in "Contour Display" dialog. Then, "Cntour Scale" dialog
will appear on the screen. The contour scale values can be modified using this
dialog.
button
in "Contour Display" dialog. Then, "Cntour Scale" dialog
will appear on the screen. The contour scale values can be modified using this
dialog.
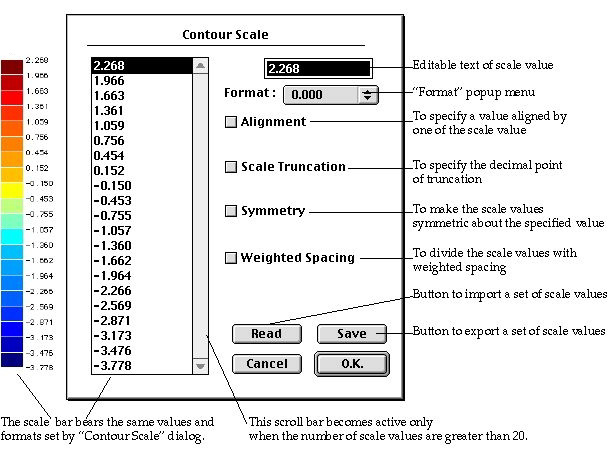
<Scale bar and "Contour Scale" dialog >
> Editing the scale values
The lower and the upper limits of each contour band are represented by the values marked on the contour scale. These values may be modified by editing the corresponding text individually. The text can be edited by the following steps.
|
1) Select the scale value for modification by clicking it. |
|
|
The selected value is highlighted with reversed background, and reflected in the editable text box. |
|
|
2) Edit the text in the editable text box. |
|
|
The scale value is modified to reflect the text editing. |
|
|
3) Repeat step 1) and 2) for all scale values to modify. |
|
|
This modification mode is terminated by clicking any other buttons, check boxes or editable texts. |
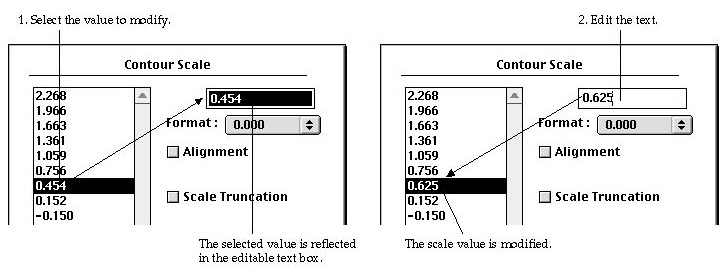
<Editing scale values >
> Setting the format of the contour scale
The contour scale values may be displayed in a number of different formats. The format can be set using "Format" popup menu in the dialog. The popup menu includes the various format items shown below. Select the desired item from the popup menu. Then, the text of the scale values shown in the dialog will be changed immediately. At the same time, that format will apply for future display.

<Setting the scale format >
> Aligning a contour to the specified value
It is sometimes necessary to display a specific value by a contour line. This can be achieved by forcing one of the scale values to be aligned to the specified value. Check "Alignment" box by clicking it. Then, an editable text item appears below the check box. Insert the value specifying the alignment into this text box. The scale values are rearranged so that one of the values matches the specified value.
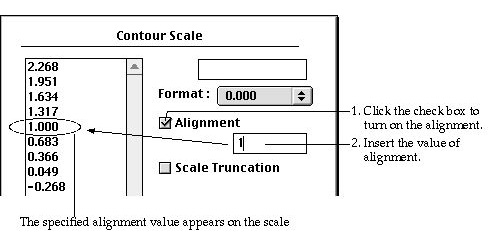
<Specifying the alignment value>
> Truncating the scale values at the specified decimal point
The scale values may be determined so that each of them is truncated at the specified decimal point. Check "Scale Truncation" box by clicking it. Then, an editable text item appears below the check box. Insert into this text box the value indicating the decimal point for truncation. The scale values are computed again with the specified truncation. The other rules of computing the scale values continue to be applied in determining them.
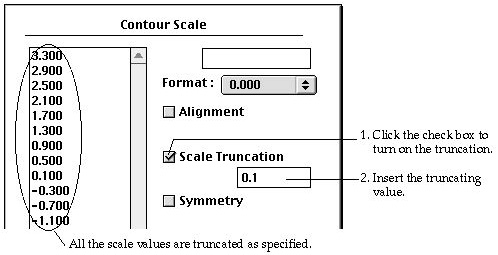
<Truncating the scale values>
> Getting symmetrically arranged scale values
It is sometimes useful to have the scale values arranged symmetrically about a specified value. Check "Symmetry" box by clicking it. Then, an editable text item labeled "About" appears below the check box. Insert the value specifying the central value of the symmetry into this text box. The scale values are reset so that the scale values are arranged symmetrically about the specified value.
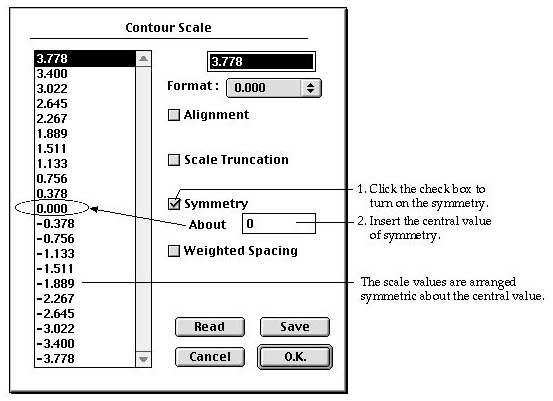
<Arranging the scale values symmetrically>
> Spacing the scale values with weight
The scale values are determined initially such that they are spread with uniform spacing between the minimum and the maximum data values. This uniform spacing may be altered to a weighted spacing. In other words, the spacing can be made to vary gradually from top to bottom with given weight. The weight is either the ratio between the space of top band and the bottom band, or the ratio between the central and the end bands, depending on whether the arrangement of the scale values is symmetric or not. If the arrangement is symmetric, editable text boxes labeled respectively as "Center" and "End" appear under the "Weighted Spacing" check box, when this box is checked. If the arrangement is symmetric, editable text boxes labeled respectively as "Top" and "Bottom" appear under the "Weighted Spacing" check box, when this box is checked.
> Possible combination of contour scale options
As described above, there are options for adjusting the contour scale values, namely "Alignment", "Scale Truncation", "Symmetry" and "Weighted Spacing" An option can or cannot be used in combination with others. The allowable combinations are summarized below.
If two options are not compatible, one option is automatically turned off when the other option is turned on. For example, "Alignment" and "Symmetry" cannot be used at the same time as shown in the table. Thus, checking "Symmetry" option will automatically uncheck "Alignment" option, if it is turned on.
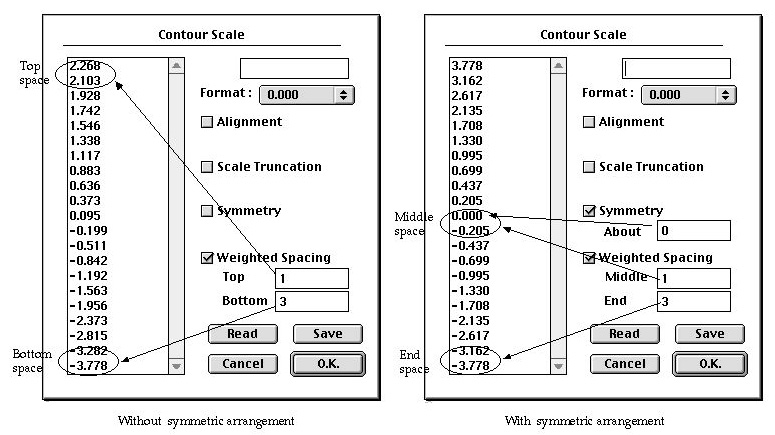
<Spacing the scale values with weight>
<Possible combinations of contour scale options>
|
Possible combinations
|
Options
|
 |
 |
> Saving contour scale values
A set of contour scale values can be saved in a file for future use. Click
![]() button
in the dialog. Then, a standard file saving dialog appears. The file is initially
named as "Untitled.cnt" but can be substituted by any other name.
The extension ".cnt" is attached simply to facilitate the identification
of contour scale files, but not always required. The number of contour bands
as well as all the contour scale values are saved in the designated file.
button
in the dialog. Then, a standard file saving dialog appears. The file is initially
named as "Untitled.cnt" but can be substituted by any other name.
The extension ".cnt" is attached simply to facilitate the identification
of contour scale files, but not always required. The number of contour bands
as well as all the contour scale values are saved in the designated file.
> Reading contour scale values
A set of contour scale values can be retrieved from a file with previously
saved contour scales. Click ![]() button
in the dialog. Then, a standard file opening dialog appears. Browse the dialog
and find the desired file with contour scale values. Only files with contour
data values will appear in the browser. Opening the file will immediately substitute
the current contour scale values by the set in the file.
button
in the dialog. Then, a standard file opening dialog appears. Browse the dialog
and find the desired file with contour scale values. Only files with contour
data values will appear in the browser. Opening the file will immediately substitute
the current contour scale values by the set in the file.
Saving and reading contour scale values are useful functions when a common contour scale should be applied to different data sets. In such case, the contour scale should be determined wide enough to cover the range of all the data sets. Possible combinations Options
|
|
|
|