![]()
| Postprocessing of Continuum Analysis > Image and Animation > Animation |
|
|
|
|
||
Animation
VisualFEA has the capability of creating and playing animations by which the data resulting from the finite element analysis may be visualized dynamically. An animation is created with a sequence of image frames directed by an animation script. The animation is saved in a file for future replay on the screen.
> Creating an animation
An animation file is created by the following steps:
|
1) Make an animation script file. |
|
 |
The animation script designates the data item for visualization and the sequence of animation. The script file should be written in ASCII text using any text editor such as "SimpleText". |
|
2) Launch VisualFEA and open the VisualFEA file to be used for animation. |
|
|
The VisualFEA file should contain a completed finite element model with analysis results. |
|
|
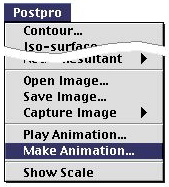
A standard file opening dialog appears on the screen, when the menu item is chosen. |
|
|
4) Open the script file. |
|
|
Browse the desired script file using the file opening dialog, and open the file. When the animation commands are completely read from the script file, a standard file saving dialog appears. |
|
|
5) Give the title of the animation file to be created. |
|
|
Insert the title of the animation file in the editable text box in the file saving dialog. The title is initially set as "Untitled.ani". This title may be replaced by a desired one. |
|
|
Extension in the file name is not necessary, but recommended only for easy identification of file type. VisualFEA endows the type of the animation file, and identifies the file by this type, and not by its extension. |
|
|
6) Let VisualFEA create and save the animation. |
|
|
Creation and saving of the animation file is started by clicking the button in the file saving dialog. While the animation is created, it is displayed on the main window. At completion of creation, the animation is saved in the file with the designated title. |
> Writing the animation script
The script file is a text file with the commands directing the sequence of the animation. A string "11" representing animation script file should be placed at the beginning of the file and followed by animation script commands.
The commands are written in ASCII text. There are a number of script commands. A command is denoted by 3 characters, and are generally followed by the starting frame number and the ending frame number, and may also be followed by one or more additional argument(s). The generic form of their format can be written as:
| com | startingFrame | endingFrame | argument1 | argument2 . . . |
The scrip commands are listed below.
|
"con" : Contour command.
Contour image is displayed from startingFrame to endingFrame . The data designated by "dat" command is used for contouring. The contour is scaled by scale1 at startingFrame and by scale2 at endingFrame . If scaleBarFlag is 0, the scale bar is not shown. If scaleBarFlag is 1, the scale bar is displayed while animation is going on. The scale changes gradually startingFrame f rom to endingFrame . For example, con 20 40 0.3 1.0 1 displays the contour image from frame 20 to 40. All the data values are scale down by the ratio of 0.3 at frame 20, and recovered to full scale (1.0) at frame 40. The scale of the data values changes gradually from frame 20 to frame 40. The scale bar is shown while the animation is going on.
|
|||||||
|
"dat" Data command.
The data of dataItem is applied from startingFrame to endingFrame . The a rgument dataItem indicates the data item in the popup menu of "Contour Display" dialog. For example, dat 1 100 4 applies the specified data set to frame 1 to 100. The 4th menu item in the popup menu of "Contour Display" dialog reads "Shear Stress XY" Thus, the shear stress xy, sxy is used for display from frame 1 to 100.
|
|||||||
|
"def" : Deformation command.
Deformation of the model is animated from startingFrame to endingFrame . The deformation is scaled by scale1 at startingFrame and by scale2 a t endingFrame . The scale changes gradually startingFrame f rom to endingFrame. For example, def 5 60 0.0 1.0 displays the deformed shape of the model from frame 5 to 60. Deformations are depressed at frame 5, and get the full values at frame 60.
|
|||||||
|
"hid" : Hidden line removed mesh command.
The model is rendered in the form of hidden line removed wireframe
|
|||||||
|
"out" " Outline command.
The model is rendered in the form of outline. |
|||||||
|
"pan" : Panning command.
The image is panned hPan pixels in horizontal direction and vPan pixels in vertical direction gradually from startingFrame to endingFrame . For example, pan 30 40 200 -100 moves the screen image 200 pixels horizontally and -100 pixels vertically from frame 30 to 40.
|
|||||||
|
"rot" : Rotation command.
The view of the model is rotated xAngle degrees about x axis, yAngle degrees about y axis, and zAngle degrees about z axis gradually from startingFrame to endingFrame . For example, rot 41 50 30.0 -120.0 0.0 rotates view 30 about x axis, -120 about y axis gradually from frame 41 to frame 50.
|
|||||||
|
"sha" : Shading command.
The model is "rendered in the form of opaque shading from startingFrame to endingFrame .
|
|||||||
|
"tra" : Transparent shading command.
The model is rendered in the form of transparent shading from startingFrame to endingFrame . The transparency ranges from m i n Transparancy t o maxTransparency in percentage. minTransparency and maxTransparency should have a value between 0 and 100. The value is 0 for opaque objects, and 100 for perfectly transparent objects. For example, tra 51 70 20.0 80.0 displays the model by transparent shading from frame 51 to 70. The minimum transparency is set as 20%, and the maximum transparency as 80%.
|
|||||||
|
"zoo" : Zoom command.
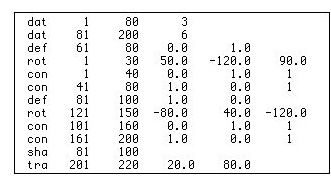
The model is zoomed to the scale of zoomScale, gradually from startingFrame to endingFrame . For example, zoom 51 70 2.0 zooms the view up to twice as large from frame 51 to 70. If 2 or more commands are in conflict with each other, the last one overrides the preceding ones. The use of the script commands is exemplified in the following, and their meanings are explained below. |

The above script will result in an animation with the following contents.
|
The total number of frames in the animation is 220, because it is the maximum value of lastFrame appearing in the script. |
|
|
The data set designated by the popup menu item 3 is applied to frame 1 to 80. |
|
|
The data designated by the popup menu item 6 is applied to frame 81 to 200. |
|
|
Deformed shape of the model is displayed from frame 61 to frame 80. The deformation scale factor is 0 at frame 61 and 1.0 at frame 80. |
|
|
The view of the model is rotated 50 about x axis, -120 about y axis and 90 about z axis. The rotation starts at frame 1 and ends at frame 30. |
|
|
The contour image is displayed from frame 1 to 40. The data scale factor is 0.0 at frame 1 and 1.0 at frame 40. The scale change gradually from 0.0 to 1.0. If the scale is 0, all data values are set as 0. If it is 1.0, the actual data values are used. The data set of popup menu item 3 is applied for contouring, because the frames are between 1 to 80. |
|
|
The contour image is displayed from frame 41 to 80. The data scale factor is 1.0 at frame 41 and 0.0 at frame 80. The scale changes gradually from 1.0 to0.0. The data set of popup menu item 3 is applied for contouring, because the frames are between 1 to 80. |
|
|
Deformed shape of the model is displayed from frame 81 to frame 100. The deformation scale factor is 1.0 at frame 81 and 0.0 at frame 100. |
|
|
The view of the model is rotated -80 about x axis, 40 about y axis and -120 about z axis. The rotation starts at frame 121 and ends at frame 150. |
|
|
The contour image is displayed from frame 101 to 160. The data scale factor is 0.0 at frame 101 and 1.0 at frame 160. |
|
|
The contour image is displayed from frame 161 to 200. The data scale factor is 1.0 at frame 161 and 0.0 at frame 200. The data set of popup menu item 6 is applied for contouring, because the frames are between 81 to 200. |
|
|
The shading image of the model is displayed from frame 81 to frame 100. |
|
|
The transparent shading image of the model is displayed from frame 201 to frame 220. The minimum transparency factor is 20%, and the maximum 80%. |
> Playing an animation

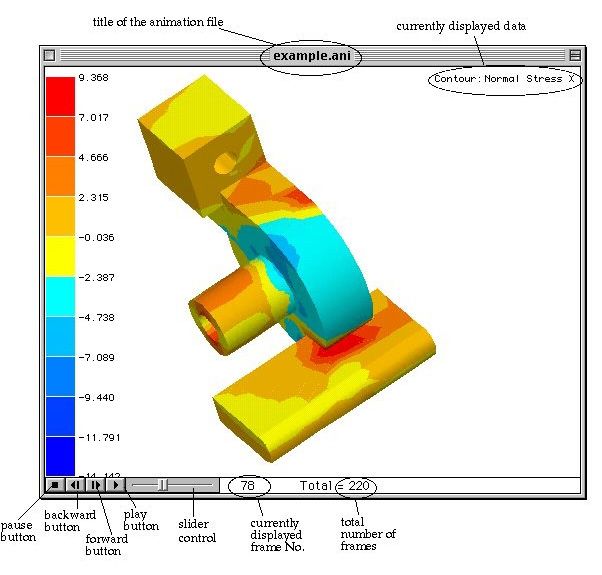
< Animation window >
|
|
|
|